Your Rent Is Buying Someone Else's House. When Does It Buy Yours?
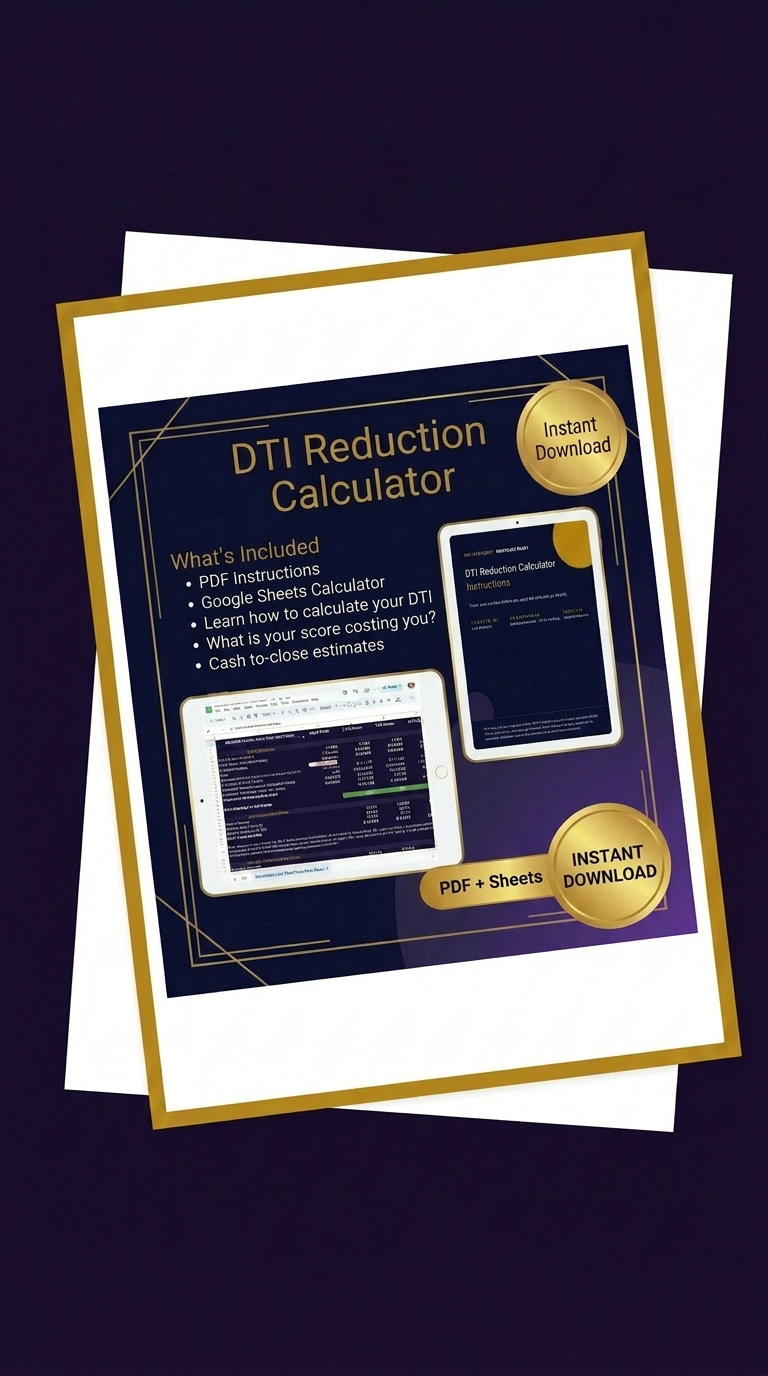
Most buyers find out their DTI is a problem when they're sitting across from a lender. This calculator puts that number in your hands first so you walk in knowing exactly where you stand. From someone who reviewed these files for 20 years.
Are You Struggling With This?
You Don't Know Your DTI Your DTI is the first number lenders calculate when they see your file. Most buyers don't know what it is until they're already in the process and by then it's too late to move it.
You Don't Know What Your Rent Actually Buys Your rent payment is going somewhere every month. This shows you exactly what that same payment buys you in a mortgage across three down payment scenarios before you ever talk to a lender.
You Don't Know What a Lower Score Actually Costs It's not just a higher rate. On a $180,000 home the difference between a qualifying score and a lower score can mean $40,000+ more over 30 years. This shows you that number with your actual income.
Your lender already knows this number. Now you will too.
Stay Connected
Questions? Email [email protected]• © 2026 Lisa | RealTalkCredit LLC All rights reserved.